
Cybersecurity Threat Monitoring: From Perimeter Sensors to AI-Ready Data Layers
Learn how cybersecurity threat monitoring has evolved to cover cloud identity platforms and AI-driven attack tactics.
In November 2025, Anthropic's Disrupting the first reported AI-orchestrated cyber espionage campaign report described an attack that AI agents mostly ran on their own. Anthropic assessed with high confidence that a Chinese state-sponsored group was behind it. AI performed an estimated 80-90% of the work, with humans stepping in only at a few critical points. The campaign targeted roughly 30 organizations worldwide and succeeded in a small number of cases. Since then, other prominent cases of AI agents independently hacking websites have made headlines.
As modern threats increasingly leverage automated tactics, classical monitoring practices have had to evolve quickly. Cybersecurity threats are monitored by collecting telemetry and evaluating it for signs of attack. Things looked very different a few years ago, when you ran IDS sensors and firewalls at the edge, and the SOC monitored north-south traffic for anything crossing boundaries.
With the cloud and SaaS dissolving that edge, an attacker holding a valid token never crosses a perimeter, so monitoring has shifted to identity providers, cloud control planes, and SaaS audit logs, where tokens leave a record. Today, attackers leverage AI to accelerate their work, and defenders are handing over monitoring work to AI tools rather than dashboards, which requires defensive agents to become increasingly sophisticated.
This article outlines four essential concepts for evaluating whether a monitoring solution can surface risks and deliver actionable data to defensive AI agents.
Summary of Essential AI-Ready Cybersecurity Threat Monitoring Features
The table below summarizes the four essential areas of tooling functionality for monitoring modern threats.
| Concept | Description |
|---|---|
| Threat-mapped and validated coverage | Coverage starts with the threats you need to detect. Map detections to the ATT&CK framework and validate them with emulation tests. Agents help to close the gaps. |
| Behavioral baselines for identities | Baselines and prevalence scoring detect activity with no known indicator, including insider threats and non-human identities acting outside their usual API patterns. |
| Measurable and continuous monitoring | Each data source's event-to-finding time is measured. A scheduled agent can confirm that telemetry is still arriving. |
| An agent-ready monitoring layer | Agents get read access to enriched findings in an open schema, raw events, and long-retention telemetry, so they can investigate without rebuilding context. Changes to detection rules go through a separate path, where the agent proposes and a human approves before deploying to production. |
Threat-Mapped and Validated Coverage
Coverage comes down to two questions: can your telemetry reveal the attacks you care about, and do your detections fire when those attacks happen? This section shows how to answer both and where agents help.
Starting from threats, not log sources
A long list of integrations shows which sources a tool can ingest data from, but not which attacks it can uncover. Realize better coverage by starting with the threats you need to highlight and working backward to the required telemetry and data fields.
The table below maps four common threats, the gaps they expose, and the shortcomings you inherit when you're missing telemetry.
| Example threat | Telemetry | Gap without the telemetry |
|---|---|---|
| Account takeover | Identity provider sign-in and MFA events (e.g., Okta or Entra ID sign-ins). | A session from a stolen cookie or an approved MFA push looks like a normal login to every downstream app. |
| Cloud control-plane misuse | Cloud audit logs (AWS CloudTrail, Azure Activity, and GCP logs). | New access keys, policy changes, and public snapshots involve no host, so endpoint tools never see them. |
| CI/CD supply chain abuse | GitHub audit log, including Git events, and secret scanning alerts. | Repository clones and pushes leave no trace once Git event retention expires. |
| Abuse of AI agent and API credentials | AI platform and application logs associated with API calls and MCP use. | A stolen key shows up as a spike on the invoice, not as a finding. |
Most attacks cross more than one source. For example, a leaked GitHub personal access token might show that:
- The attacker used the token from an unfamiliar ASN to clone private repositories.
- The attacker found AWS credentials in a CI configuration file.
- The attacker used those credentials against your cloud account.
GitHub records clones, Secret Scanning flags exposed credentials, and CloudTrail records AWS calls. Each event appears minor on its own, but a breach is apparent only when the events are correlated across all sources and put into context.
AlphaSOC ingests telemetry from GitHub, AWS, Okta, Entra ID, CrowdStrike, and Zscaler, among others, and provides managed detection to make the work of a security team easier, finding issues such as "Secret found in a GitHub repository" and "High number of non-public GitHub repositories downloaded."
In the case of GitHub, if you're on the enterprise plan, you get audit log lists of events from the last 180 days, but you only get to keep Git events for seven days. If you don't stream them out within that window, evidence of a mass clone is gone before most investigations begin. Once streamed to AlphaSOC, your normalized logs stay in hot storage for 18 months by default.
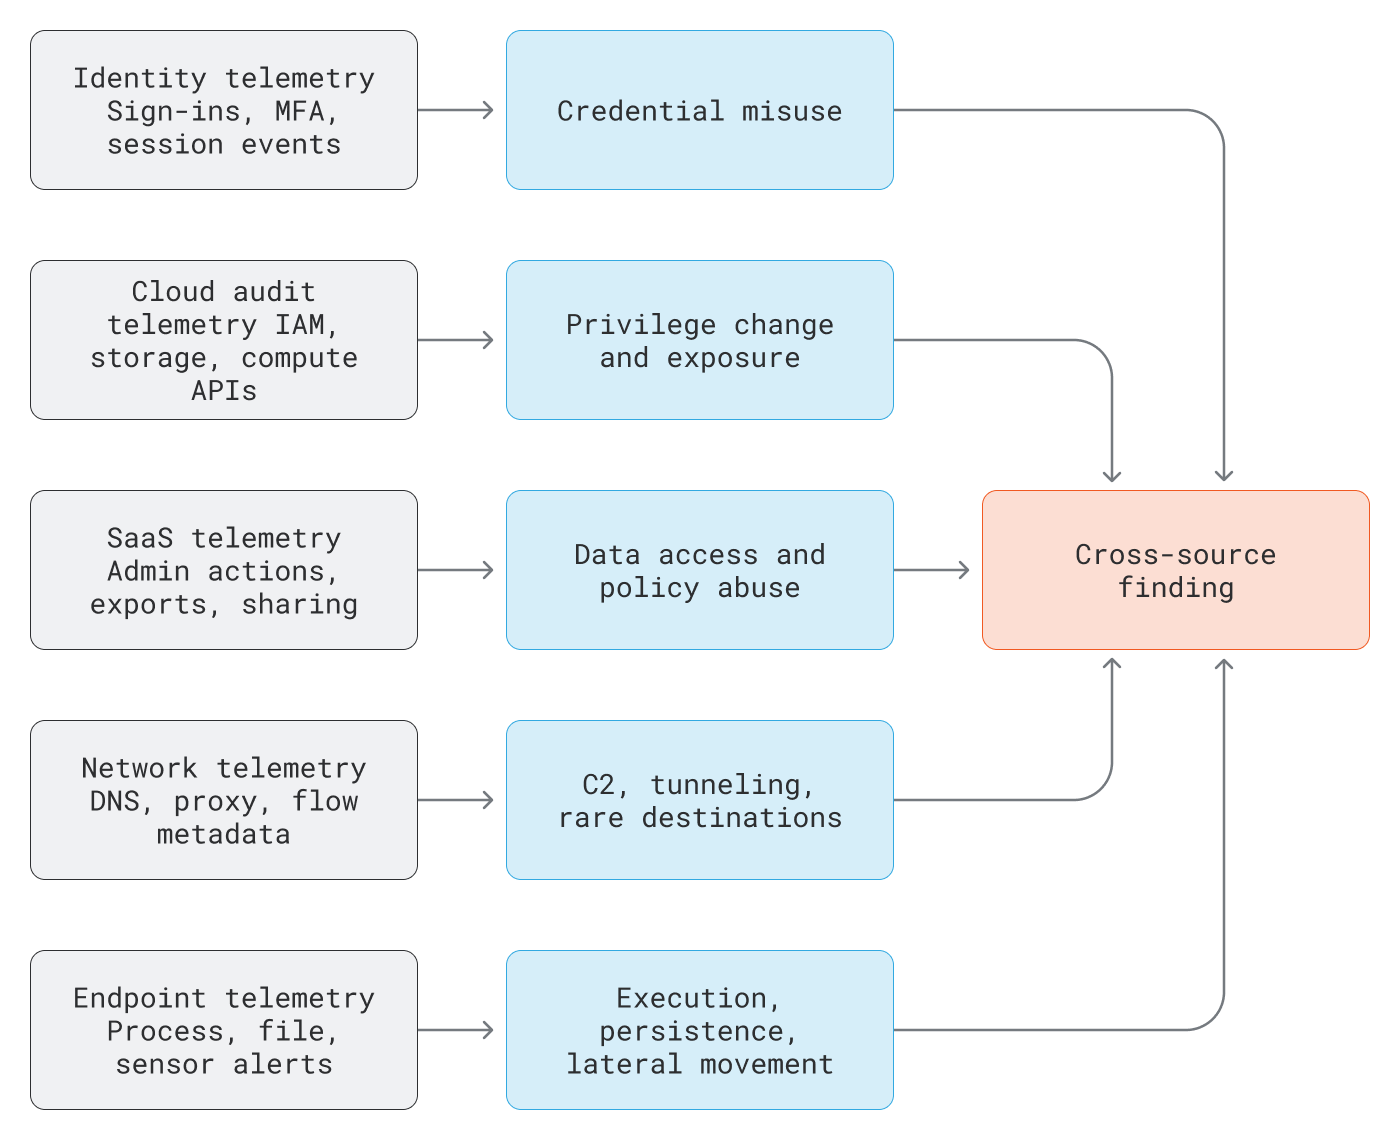
Security teams need cross-source telemetry to track malicious activity across cloud platforms, applications, networks, and endpoints.
Validating coverage and closing gaps with agents
Counting detection rules says little about coverage because rules can typically cluster on a handful of techniques and leave whole tactics untouched. A better approach to check coverage is to map each managed and custom detection to MITRE ATT&CK, then test the mapping.
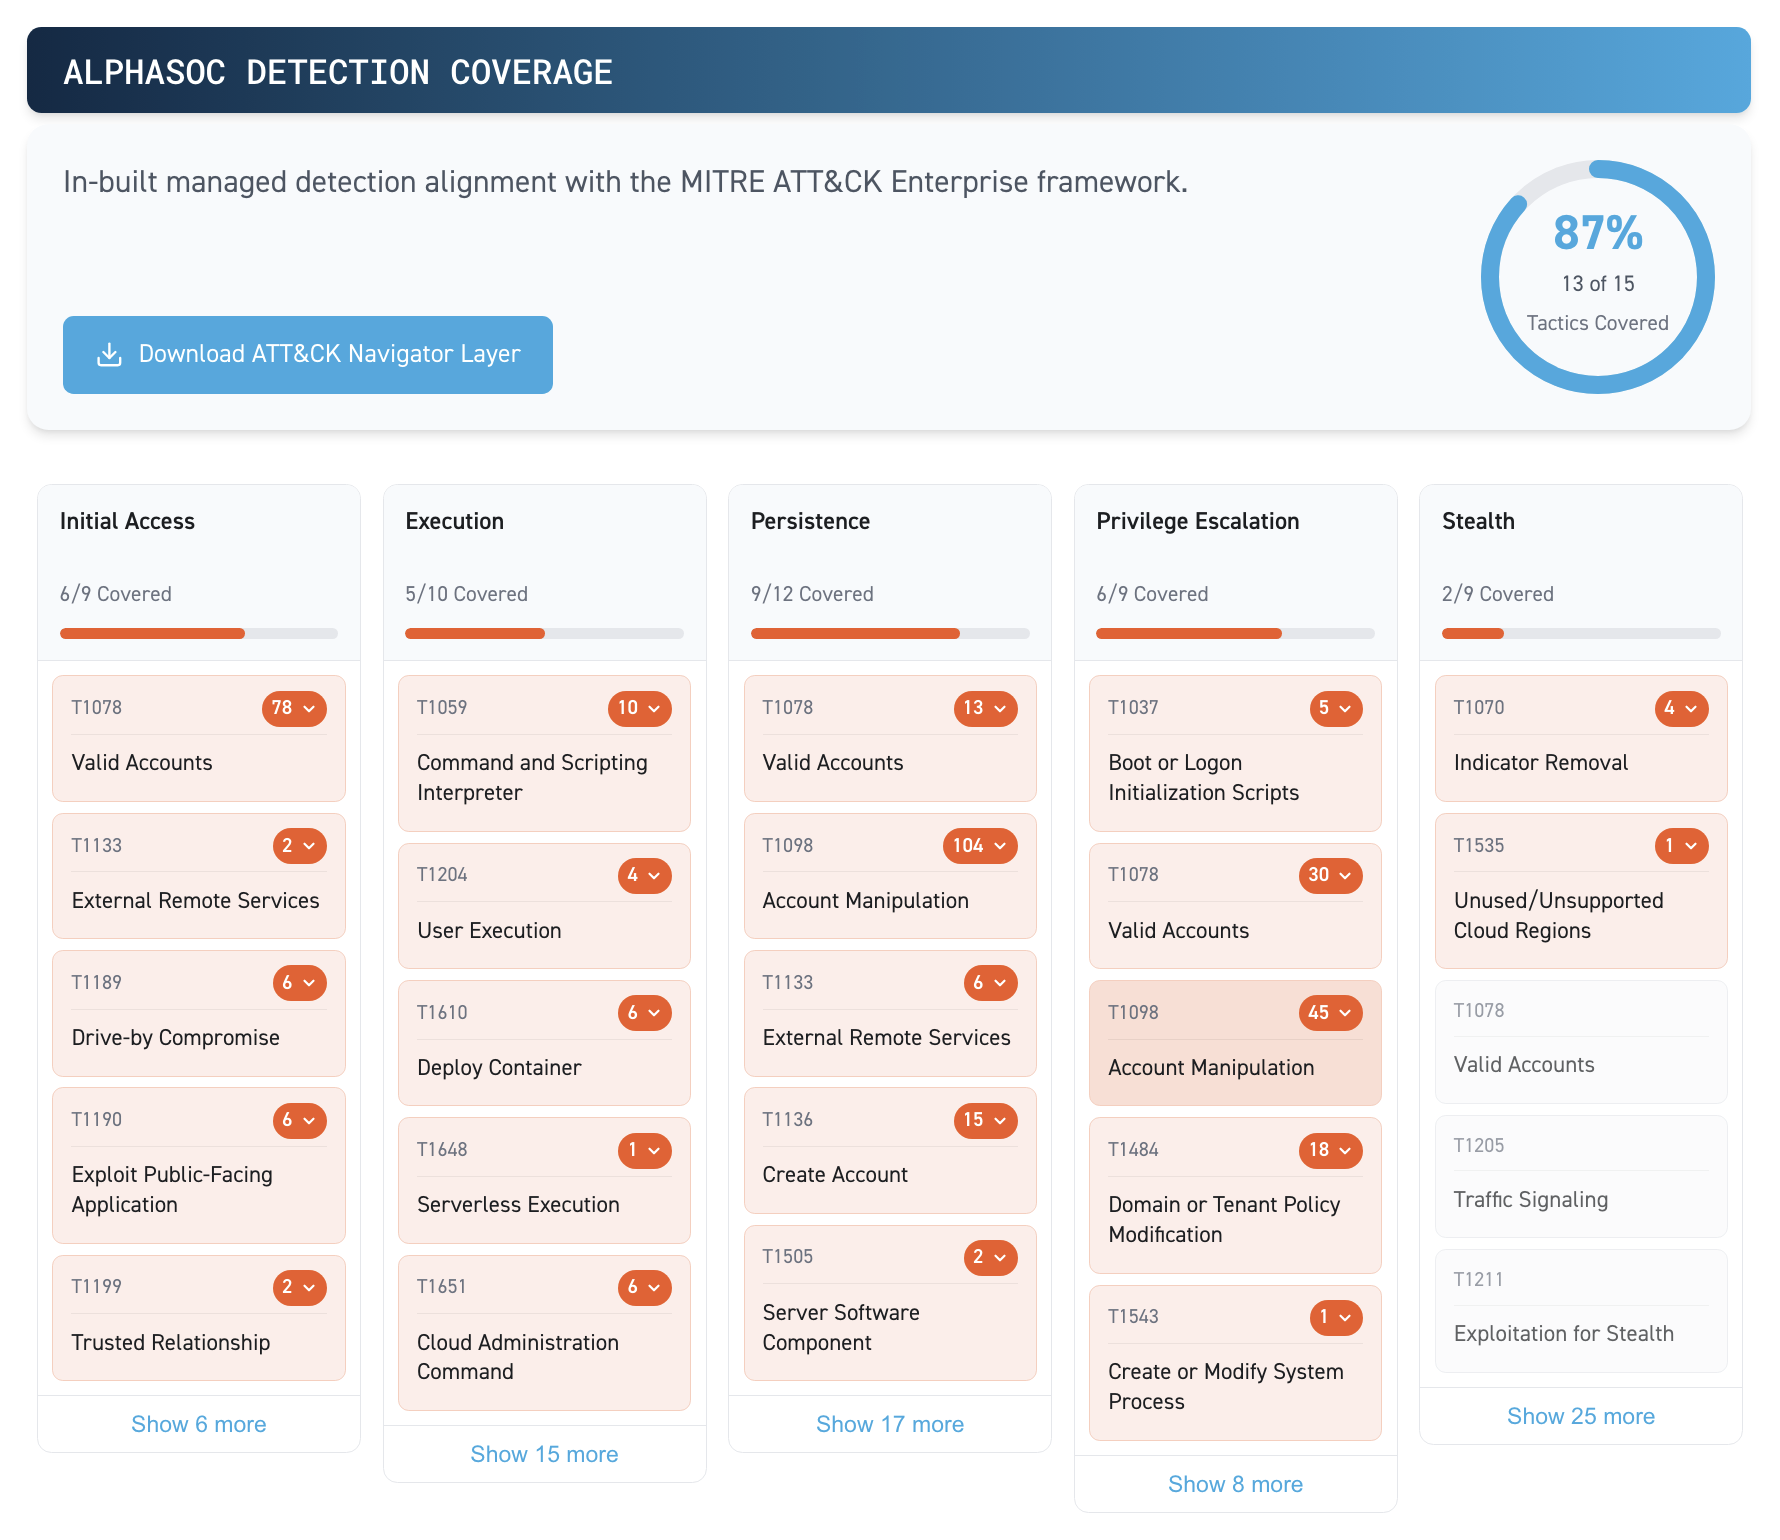
AlphaSOC's managed detections cover 13 of the 15 ATT&CK tactics by default. The exception is Reconnaissance (as shown below), which mostly happens outside your environment. You can download the map as an ATT&CK Navigator layer file and compare it with your custom rules.
When you test, you need to run a technique and confirm that a finding appears, for instance:
- Atomic Red Team and MITRE Caldera emulate attacker techniques on endpoints.
- Stratus Red Team, maintained by Datadog, describes itself as the Atomic Red Team for the cloud. It covers AWS, Azure, GCP, Entra ID, and Kubernetes.
It's good practice to rerun these tests in continuous integration (CI) to make sure that a parser change or tuning decision doesn't break previously working detections. Agents speed things up, and a typical loop runs in five steps, as shown in the figure below.
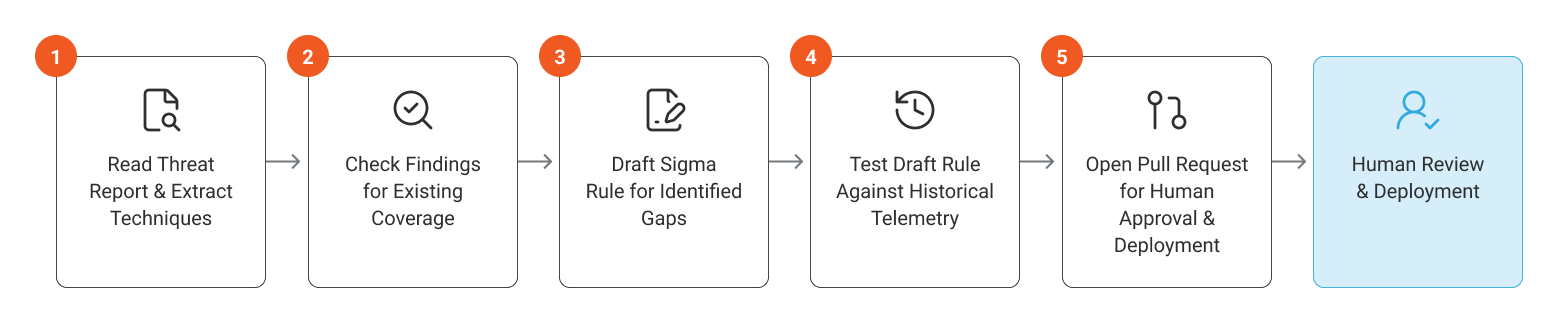
Steps 1 and 3 involve extracting threat intelligence and drafting rules, while steps 2 and 4 involve reading findings and telemetry. Step 5 changes production, so it requires human review. AlphaSOC's Model Context Protocol (MCP) server fits this split. An agent can roll up findings by ATT&CK technique and search the data lake. Custom Sigma detection rules reach production via CI/CD and the detection management API after a human approves the pull request.
For more on managing rules this way, see the threat detection tools article.
Behavioral Baselines for Identities
Many of the hardest attacks to detect use valid credentials and leave no known indicator behind. Baselines and prevalence scoring surface that activity, and they apply to insiders, compromised accounts, and non-human identities alike.
Baselines detect threats missed by standard indicators
Indicator matching catches only activity someone has already seen, so activity with no known indicator needs a baseline. The table below compares four detection methods.
| Method | Catches | Misses |
|---|---|---|
| Indicator matching | Known bad IPs, domains, certificates, and file hashes. | Novel infrastructure not yet reported. |
| Rule logic | Known techniques with a defined pattern. | Variants outside the rule's conditions. |
| Baselines | Departures from normal behavior. | Activity that was already happening when learning began. |
| Prevalence | Behavior that is rare across a population. | Common behavior that an attacker abuses. |
A baseline can cover one identity, a peer group, an environment, or many customers. AlphaSOC, for example, measures prevalence at two of these levels, within your environment and across all of its customers. It flags first-time API calls, unusual admin actions, and rare destinations against both. Prevalence is one of six scoring layers in AlphaSOC's engine and is also described in the threat detection tools article.

Statistical models baseline at stream scale, and LLM agents then explain and investigate the findings that surface. This split works because running an LLM on every event is too slow and costly, whereas running it on each finding is more affordable.
Baselines have three pitfalls, however:
- A new tenant, service, or account has no history, so there is no baseline to compare against. Cross-customer prevalence fills this cold-start gap because an API call made by a few customers still stands out.
- Attacker activity within the learning window returns to normal. If an attacker exports data in the first weeks of training, the baseline learns that exports are routine.
- Month-end batch jobs, quarterly access reviews, and deploy days create seasonal bursts that look anomalous.
Insiders, compromised accounts, and non-human identities
A malicious insider and a compromised account look the same in telemetry because both use authorized access in an unusual pattern. The following are examples of behavior worth investigating:
- First-time access to a sensitive repository or data store
- Bulk export or download of repositories, Confluence, or file shares
- Rare administrative actions
- A service account used interactively
- AI agents, OAuth apps, and CI tokens acting outside their usual API set
Some of these are handled by AlphaSOC's managed detections, such as "High number of non-public GitHub repositories downloaded" and "Confluence site exported."
An AI agent can automate the entire investigation by interfacing directly with AlphaSOC's MCP server. External AI assistants can connect seamlessly over HTTP to query telemetry, search records, and evaluate findings across the data lake. The following command shows how Claude connects to the server:
claude mcp add --transport http alphasoc https://api.alphasoc.net/mcp
Once connected, the agent executes structured investigative steps using specialized MCP tools:
- Resolve identity: Uses
lake_searchto map exact user and device strings across OCSF logs (e.g., matchingjane.doe@example.comto normalized records). - Analyze baseline activity: Runs
findings_summaryto roll up historical activity, benchmarking the user against peer groups and flagging anomalous actions. - Escalate to analyst: Generates a comprehensive timeline of evidence and hands the case over for human review.
Interpreting some insider behavior requires HR context. CISA notes that most people under stress don't turn to harmful acts, so concerning behavior alone isn't proof of a threat. CISA's Assembling a Multi-Disciplinary Insider Threat Management Team guidance recommends including HR and legal counsel on the team.
Measurable and Continuous Monitoring
Vendors describe their monitoring as continuous, and the only way to test that claim is on a source-by-source basis. For each source, measure how long it takes for an event to become a finding, and confirm that telemetry is still arriving.
Detection latency
In 2025, the average e-crime intrusion took 29 minutes to move from initial access to other systems, according to the 2026 CrowdStrike Global Threat Report. The fastest breakout took 27 seconds, and in one intrusion, data exfiltration began within four minutes of initial access.
At those speeds, a "real-time" label tells you little until you measure, per source, how long it takes an event to become a finding. The total time is the sum of five separate delays, as broken down in the following table.
| Delay type | What adds delay | Key questions to ask |
|---|---|---|
| Source delivery delay | The source service batches telemetry before it exposes it. | What delivery time does each source document? |
| Pipeline transit | Collection, queuing, and normalization between the source and the monitoring tool. | What is the measured transit time per source? |
| Evaluation interval | A saved search on a 15-minute schedule adds up to 15 minutes before any detection sees the event. | Does the analysis run on a schedule or on each event? |
| Escalation | A finding waits in a queue before it reaches a person or a ticket. | How long from finding to notification? |
| Agentic triage time | An AI agent needs time to enrich and assess each finding. | How long does triage take per finding? |
AWS documents that CloudTrail delivers log files within an average of about 5 minutes of an API call and that this time isn't guaranteed. No monitoring tool can remove this delay, so every detection built on CloudTrail inherits it.
AlphaSOC analyzes events in real time and delivers OCSF detection findings, which removes the evaluation interval. Source delivery delay still applies, so ask every vendor for measured event-to-finding latency by source and verify it end-to-end during any evaluation.
Telemetry health
Consider a case where an Okta API credential expires on a Friday evening. The log pull stops, no Okta findings appear all weekend, and the dashboard looks quiet. A broken pipeline and a quiet network both produce zero findings, so you need a separate check that telemetry is still arriving.
That's one of three failures that raise no error for the analyst:
- An expired API credential stops a log pull, such as the Okta System Log mentioned above.
- An attacker disables cloud audit logging, so later actions go unrecorded. AlphaSOC's managed detections include "GCP Logging sink deleted" and "Azure diagnostic setting deleted" for this case.
- A vendor schema change breaks a parser and drops a field, so a rule that depends on that field never matches again.
A scheduled agent can check for sources that went quiet and open a ticket. AlphaSOC's MCP server provides telemetry_summary for this check. It reports hourly event volume per data origin, credential, and data type, for up to 31 days per call.
You can ask the agent in plain language:
"In Production, show hourly event volume from each data origin over the last day. Which sources dropped to zero compared with earlier hours?"
A missing hour means no events were counted in that hour, so compare adjacent hours and the source's expected schedule before treating it as an outage. The current hour may also be incomplete.
An Agent-Ready Monitoring Layer
Agents can triage findings, hunt, and tune detections, but only with the data and access the monitoring layer gives them. Here we describe what a headless SOC needs from its data, the access that agents need, and the guardrails that enable them to work safely.
Headless monitoring
Monitoring work increasingly runs through Slack, terminal CLIs, and coding agents, without anyone needing to open a web console. Tools such as Artemis Security, Vega Security, Scanner, and AlphaSOC all offer MCP servers that agents can connect to, but whether a headless SOC works efficiently depends on the data behind that server.
Some platforms store telemetry in their own schema and expect queries in their own language. Every prompt, saved query, and detection you build then depends on the platform's inner workings. Adopting open standards ensures portability by relying on OCSF for schemas, Sigma for detection logic, and MCP for agent integration.
The table below lists three features to look for in the data layer of a headless SOC:
| Feature | What to look for | Practical significance |
|---|---|---|
| Open portable formats | Telemetry normalized to an open schema such as OCSF, detections written in Sigma, and a widely used query language such as KQL or SQL. | The agent sees the same fields in every source. Its rules and queries also follow you if you switch platforms. |
| Enrichment before the agent | Prevalence, reputation, and threat intelligence attached to each event as it's processed. | The agent doesn't spend time and tokens calling outside services. It also doesn't need its own API keys for them. |
| Context in every finding | The evidence, user, device, and related activity behind each finding, linked to the raw events. | The agent can explain a finding and decide what to check next without having to rebuild the story itself. |
Here's what enrichment looks like on an OCSF DNS Activity event, for example. OCSF defines the enrichments array, but each vendor chooses what goes in data.
{
  "class_uid": 4003,
  "category_uid": 4,
  "activity_id": 1,
  "time": 1794321125000,
  "src_endpoint": { "ip": "10.0.4.17", "hostname": "build-runner-01" },
  "query": { "hostname": "cdn-update.example", "type": "TXT" },
  "enrichments": [
    {
      "name": "query.hostname",
      "value": "cdn-update.example",
      "type": "prevalence",
      "data": { "global_hosts": 1, "local_hosts": 1, "first_seen": "2026-11-09" }
    }
  ]
}
From this event alone, an agent can see that a build runner is the only host anywhere to query this domain. It can also see that the domain first appeared the day before and learns both without an outside lookup.
AlphaSOC normalizes telemetry to OCSF and runs Sigma rules natively. It scores each event's prevalence in your environment and across customers. AI agents receive the event context, and even if it changes, open-format data remains useful to whichever agent is used next.
What agents need from the data layer
An agent can only work with the records it reads, so whichever architecture you choose, check the data layer for three more things:
- Access to the raw events behind each finding, because the investigation needs more than the finding itself
- Enough retention to look back weeks or months after an event
- A controlled path for changing detections, separate from the path for reading data
AlphaSOC's MCP server accepts any AI tool that supports Streamable HTTP with OAuth. An agent can read OCSF findings, evidence, activity, and raw events. Normalized telemetry is kept hot for 18 months by default. Sigma rules are deployed through our detection management API, which imports a zip archive of rules in merge or replace mode, allowing rule changes to run through CI/CD.
Implementing guardrails
The value of using agents comes from small loops that run on a schedule or a trigger, such as these:
- A daily triage digest in Slack, built from a prompt such as "What fired overnight in Production? Group it by detection and show me the worst first."
- A weekly tuning review that starts from "Which detections produced the most events last week?" and proposes suppressions for a human to apply.
- A retrospective hunt when a threat report lands, where the agent extracts the indicators and checks them against historical telemetry.
- Rule-tuning proposals that the agent submits as pull requests.
While these autonomous loops drive fast response and continuous tuning, allowing AI agents to interact directly with detection pipelines requires strict controls. Some guardrails are essential to put in place to prevent these automated actions from executing without introducing risks:
- Let the agent propose changes and require a human to merge them.
- Keep read and write access separate because the read-only MCP connection shouldn't share credentials with the pipeline that deploys rules.
- Keep an audit log of what each agent did.
- Monitor the agents' own credentials. Each agent holds keys to your telemetry, and leaked agent and API keys were one of the threats in the coverage section.
Conclusion
You don't need to rebuild your entire SOC to manage today's cybersecurity threats. Instead, plan to implement the four features discussed in this article as follows:
- Pick your top threats, including abuse of AI agents and API credentials. For each one, confirm that the telemetry exposing it is gathered, then validate coverage using emulation and testing.
- Establish identity baselines that include non-human identities such as service accounts, OAuth apps, and agents. Before you widen that to insider threat monitoring, agree on the scope with HR and legal.
- Measure how long an event takes to become a finding, per source. Then add health checks so that a source that goes quiet raises a ticket for triage.
- Connect your AI tools to the monitoring layer with appropriate guardrails. Start with read-only triage, then let the agent propose rule changes for human review and merge.
AlphaSOC's onboarding is self-service, with no agents or sensors to deploy, and you can connect your AI tools to our data lake through MCP. Get started for free.