A Guide to Advanced Threat Detection Tools
Learn which features to look for in threat detection tools, from layered pipelines to Sigma support.
Static indicators are immediately out of date. Attackers rotate infrastructure between campaigns, so blocklists and file hashes lose value the moment they're compiled. SIEMs like Splunk, Microsoft Sentinel, and Google SecOps responded by adding behavioral analysis, but the trade-off was steep: high licensing costs, complex data pipelines, and low-fidelity alerts that still require manual enrichment and investigation. These platforms were designed for correlation and investigation, not for deeply inspecting terabytes of raw telemetry.
A new generation of threat detection tools addresses this problem by introducing a purpose-built processing layer. Raw telemetry flows from customer sources to the detection engine first, through transports like cloud storage, Kafka, and Cribl. A dedicated threat detection engine processes telemetry in depth and delivers refined findings to the SIEM for investigation.
Threat detection has evolved through three distinct phases, each driven by the limitations of the one before it.

This article discusses these phases and breaks down the features worth evaluating in threat detection tools.
Summary of Key Features of Advanced Threat Detection Tools
| Feature | How it's done | What to look for |
|---|---|---|
| Multi-layered detection pipeline | SIEMs correlate across three dimensions (reputation, threat intelligence, basic heuristics). Attackers only need to evade a few checks. | Six or more dimensions of independent analysis run against telemetry in parallel, so each layer catches what the others miss. |
| Detection as code (DaC) | Rules are written in vendor-specific languages (SPL, KQL, EQL), locked to one platform, and maintained manually. | Native Sigma support with no conversion step. Rules version-controlled in Git, deployed via CI/CD, and portable across platforms. |
| Alert correlation and incident modeling | Analysts manually connect related alerts across tools. High alert volume with low context per alert. | Automatic grouping of detections across identities, endpoints, and timeframes into composite alerts enriched with context. |
| Retrospective detection and data lakes | Historical hunting limited by SIEM retention costs and proprietary schemas. Old telemetry is expensive to query or has already been deleted. | An OCSF-normalized data lake where new rules and updated intelligence can surface threats that were invisible at ingestion time. |
| SIEM and SOAR integration | Integration is typically one-way: Alerts push to the SIEM, but teams can't programmatically deploy rules, query data, or trigger actions back in the detection tool. | An API-first platform where AI agents can deploy rules, receive alerts, and query historical data programmatically. |
| Transparent pricing and low operational overhead | Per-GB ingestion pricing penalizes telemetry volume. Teams cut data sources to save budget, creating visibility gaps. | Usage-based pricing with no ingestion penalty and with out-of-the-box detections and SaaS or on-premise deployment with feature parity. |
Multi-Layered Detection Pipelines
Correlating network traffic against a single threat feed and firing an alert is no longer enough. Now attackers rotate infrastructure between campaigns, register fresh domains for each operation, and avoid reusing indicators that might land on a blocklist. Specific detection tools that rely on a single analysis technique miss anything outside that specific attack vector.
A layered pipeline stacks multiple techniques, so each one covers the blind spots of the others. For instance, a destination might clear reputation checks because it's brand new, but prevalence analysis flags it because no other environment has contacted it. Or a beaconing pattern might look like normal polling until time-series analysis reveals fixed intervals consistent with command and control.
Many SIEMs perform some behavioral analysis out of the box, but this processing tends to be shallow. It's usually about reputation lookups, threat intelligence matching, and basic heuristic rules. That's three techniques.
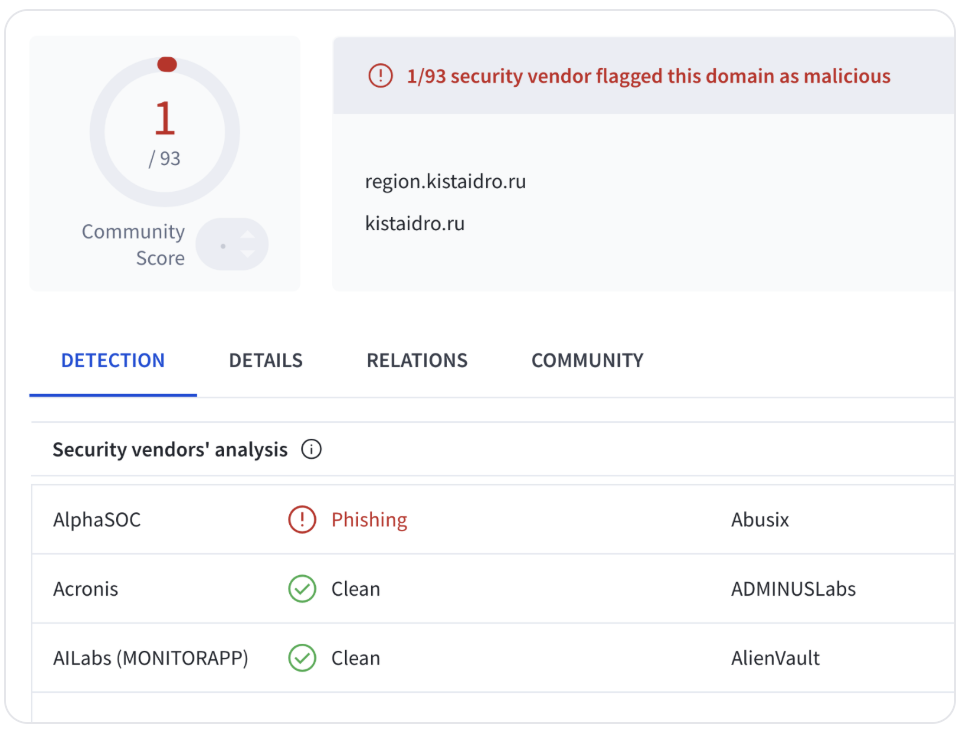
A mature detection pipeline runs more independent layers against the same telemetry. Part of that depth comes from live external context, which is the additional signals that tell you whether a detection matters. AlphaSOC's engine is built around closing that gap. It provides real-time reputation scoring and contextual signals, whether a domain is a suspicious TLD, an impostor candidate, or unique to your tenant. Each contextual signal feeds directly into the engine's processing layers.
Running an in-depth analysis inside the SIEM is cost-prohibitive because the architecture wasn't designed for it, which is why a purpose-built sidecar engine is useful for processing at scale, even before alerts reach your analysts. The following diagram shows what this pipeline might look like:

Each layer accomplishes a specific task and has a specific outcome, as shown in this table:
| Layer | What it does | What it catches |
|---|---|---|
| Active fingerprinting | Probes unknown destinations in real time (TLS certificates, HTTP headers, server behavior) to identify C2 infrastructure before it hits any blocklist. | Brand-new C2 servers with no reputation data. A self-signed cert issued yesterday and headers matching a known Cobalt Strike profile give it away. |
| Reputation scoring | Queries live services (Google Web Risk, VirusTotal) to check whether a destination is already flagged as malicious. | Threats reported to reputation databases but not yet propagated to your local feeds. Feed update cycles can lag by hours or days. |
| Prevalence analysis | Compares traffic destinations across a broad population of environments (a domain contacted only by your organization stands out). | Zero-day infrastructure that nobody else is talking to; this can be invisible to reputation scoring because there's nothing to score yet. |
| Time series analysis | Examines traffic timing: beaconing intervals, volume spikes, and unusually long-lived connections. | C2 beacons every few minutes look benign as individual queries. Over hours, the pattern is unmistakable. |
| Feature classification | Analyzes the structural characteristics of traffic (hostname entropy, subdomain length, encoding patterns) to detect tunneling and DGAs. | DNS tunnels are routed through legitimate resolvers. The destination is clean; the query structure isn't. |
| Threat intelligence matching | Correlates telemetry against live, curated indicator feeds containing IPs, domains, and file hashes. | Documented threats tied to known actors and campaigns, caught faster than stale bulk-aggregated lists would allow. |
Individual layers have blind spots. For example, reputation scoring can miss new infrastructure, and prevalence analysis can flag legitimate niche services. But stack all six layers together, and a false negative on one layer is caught by another. A genuine threat triggers multiple layers simultaneously. Using six dimensions of analysis reduces false positives and catches threats that three-dimensional pipelines miss entirely.
Detection as Code (DaC)
Sigma is to log-based detection what Snort is to network traffic and YARA is to files: a vendor-agnostic format for describing detection logic. Instead of writing detection rules in SPL (Splunk), KQL (Microsoft Sentinel), or EQL (Elastic), you write them once in Sigma and deploy them anywhere.
Detection as Code (DaC) draws on well-established software engineering principles. Rules live in a repository, undergo peer review, and are deployed via CI/CD pipelines. Changes are tracked, rollbacks are easy, and your detection logic is portable rather than locked inside one vendor's platform. The SigmaHQ community GitHub repository puts this into practice with thousands of rules that teams can instantly leverage rather than writing everything from scratch.
The conversion problem
So why hasn't Sigma adoption been faster? The format has been available for years, the community is active, and the value proposition is clear. The issue is the conversion layer.
Sigma's original promise was "write once, run anywhere." In practice, teams still incur real overhead because Sigma rules need to be converted into platform-specific query languages before they run. Poor implementation can generate errors leading to additional effort to rule set-up.
| Step | What goes wrong |
|---|---|
| Conversion | Converters like sigma-cli don't support every rule feature equally across backends. Some field mappings break, some logic gets simplified or dropped entirely. |
| Testing | A rule that works in Sigma YAML might produce unexpected results after conversion to SPL, KQL, or EQL. Teams end up testing twice: once in Sigma, once in the target platform. |
| Maintenance | When someone updates the Sigma source rule, the converted version doesn't update automatically. Rule drift accumulates silently over time. |
| Debugging | When a converted rule misfires or fails to fire, you're debugging the translation, not the detection logic. The problem you're solving has nothing to do with threats. |
Native Sigma support eliminates this entire layer. You write Sigma and deploy it directly to the detection engine with no conversion step, platform-specific debugging, or drift between your source rules and what's actually running. The idea is to pull a rule from SigmaHQ (like in this code snippet) and have it run immediately.
# Example: Sigma rule detecting DNS queries to known DGA patterns
title: Suspicious DNS Query to DGA Domain
status: experimental
logsource:
  category: dns
detection:
  selection:
    query|re: '^[a-z0-9]{12,}\.(top|xyz|biz|click)$'
  condition: selection
level: medium
With native support, this rule deploys as is. The detection engine reads the Sigma YAML directly and instantly applies it to the pipeline. Custom rules also get the same tuning controls as built-in detections. For example, you can adjust severity, suppress known-good destinations, or scope a rule to specific systems.
AlphaSOC supports Sigma as a first-class standard. The cost reduction is concrete: no converter maintenance, rule drift, or vendor lock-in tying your detection logic to one platform's query language. This means that the pipeline is shortened significantly, as shown below.
 vs traditional Sigma workflow")
Alert Correlation and Incident Modeling
Imagine five alerts landing in your queue within an hour:
- One flags a DNS query to a recently registered domain.
- Another shows beaconing from the same endpoint.
- A third catches a login anomaly for the user tied to that endpoint.
- A fourth one spots an outbound data transfer that breaks baseline volume.
- And a fifth matches a Sigma rule for suspicious PowerShell execution.
Individually, each alert is ambiguous, but together, they describe a compromise in progress.
Strong tooling lets you connect them without operational overhead. Correlation groups these detections across identities, endpoints, and timeframes into composite alerts. Instead of five separate low-confidence notifications, your analysts get one high-confidence alert that tells a coherent story.
The quality of that alert depends on the context it is attached to. A raw detection that says "DNS query to suspicious domain" forces the analyst to look up the endpoint, identify the user, check what else happened, and determine whether the destination matters. An alert enriched with context, such as asset role, user identity, rule references, threat category, and related micro-detections, lets the analyst triage immediately.
| Without correlation | With correlation |
|---|---|
| Five separate alerts, each with low confidence | One composite alert, high-confidence |
| Analyst manually connects the dots across tools | Related signals pre-grouped by identity and timeframe |
| Raw event data with no context | Each detection arrives pre-enriched with context (asset role, user identity, threat category) |
| Alert fatigue → analysts start ignoring noise | Fewer alerts → each one gets investigated |
The table above shows both concepts at work. Correlation is the grouping of five alerts into one composite finding. Context is the enrichment: asset roles, user identity, and threat category attached to that finding, so the analyst doesn't start from scratch. A tool that correlates without enriching still leaves analysts chasing background information. A tool that enriches without correlating still leaves them drowning in individual alerts.

AlphaSOC's engine clusters detections and scores them together. When multiple layers flag activity tied to the same endpoint or user within a correlated timeframe, the engine produces a single context-rich alert rather than a stream of isolated notifications. Teams can also tune correlation sensitivity, for example, by adjusting scoring thresholds, whitelisting known-good infrastructure, and suppressing specific rule combinations that generate noise in the environment.
Retrospective Investigation
Strong detection systems report in near real time: Telemetry flows in, rules evaluate it, and alerts fire or don't. But threats don't always arrive with detectable signatures. A new threat intelligence report scheduled for publication next week might describe C2 infrastructure that was active in your environment last month. A Sigma rule to be written tomorrow might catch a technique that's been running undetected for weeks. Without stored telemetry, those threats stay hidden permanently.
A telemetry data lake stores normalized logs for months or years, well beyond the 2-4 weeks that most SIEMs retain before data ages out or gets deleted. That extended retention is what makes retrospective investigation possible.
The Open Cybersecurity Schema Framework (OCSF) defines a common schema for security telemetry across sources, so cloud audit logs, endpoint events, and network data all land in the same structure. Normalization of telemetry enables common logging, reduces overhead, reduces alert lag, and reduces the latency of threat detection.
Here's how data lakes work in practice.
| Use case | What the data lake enables |
|---|---|
| Delayed threat detection | A new Sigma rule or updated threat feed can surface activity that looked benign at ingestion time. |
| Post-incident forensics | Forensics lets teams trace lateral movement, credential access, and exfiltration paths across weeks or months of stored telemetry. |
| Compliance reporting | Reporting enables retaining and querying normalized logs against regulatory requirements without rebuilding data from raw sources. |
| Long-range threat hunting | Hunting and investigating is possible across months of retained data for low-and-slow attacks that don't trigger real-time detections, long after a typical SIEM would have aged out the evidence. |
Retrospective analysis and patient-zero detection are often conflated, but they solve different problems. Retrospective analysis searches backward through stored data using signatures or rules that didn't exist at ingestion time. Patient zero detection works forward. It flags anomalous patterns proactively, surfacing activity that doesn't match any known indicator but behaves suspiciously across multiple analysis layers.
AlphaSOC tracks the prevalence of artifacts, highlights suspicious patterns, and performs active scanning to discover malicious infrastructure.
AlphaSOC's multi-layered pipeline detects patient-zero threats in real time through behavioral analysis, while a customer-specific data lake supports retrospective investigation and hunting when new context emerges weeks or months after the fact. The data lake also enables federated searches from your SIEM, so analysts can pull historical context during an investigation without leaving their primary workflows.

SIEM, SOAR, and AI Integration
A detection tool that doesn't fit your existing stack creates more work. The goal of tooling is to augment what you already have, meaning that your SIEM stays as the investigation layer, and the detection engine feeds it higher-quality alerts without forcing a rip and replace.
The traditional integration landscape covers what you'd expect:
- SIEM platforms such as Splunk, Google SecOps, or Microsoft Sentinel
- SOAR tools like ServiceNow and Cortex XSOAR
- ChatOps tools like Slack and Microsoft Teams
- Ticketing systems like Jira and Opsgenie
- Direct API access that AI platforms can leverage
Format flexibility determines how cleanly alerts land in your pipeline. JSON works for custom integrations and OCSF for standardized schemas. A detection tool that only outputs one format forces you to build a translation layer on top of it.

When your detection engine is API-first, things get interesting. In addition to consulting alerts, AI agents and agentic SOAR platforms interact with the detection engine as an active participant in the investigation loop. An agent can push a custom Sigma rule to the engine when it identifies a new threat pattern without waiting for a human to write and deploy the rule manually. When alerts fire, they flow directly into automated triage playbooks that handle enrichment, severity scoring, and escalation. Mid-investigation, an agent queries the telemetry data lake to pull historical context, tracing lateral movement or surfacing related activity from weeks earlier.
Let's say an AI agent receives an alert for suspicious DNS beaconing. The agent queries the data lake for all activity from that endpoint over the past 30 days, identifies three additional indicators that correlate with the beaconing pattern, and deploys a targeted Sigma rule to monitor for the same technique across the rest of the environment. The entire workflow runs through the API without a human touching the console.
The difference between a detection tool that analysts check and a detection platform that works alongside them lies in API coverage. If every action available in the console is also available through the API, agents can operate the platform. If the API only exposes alert retrieval, agents are just reading a queue.
AlphaSOC's REST API and web console make this practical. The engine outputs in multiple formats for different pipeline architectures, and every action available in the console is available through the API.
Transparent Pricing and Low Operational Overhead
SIEM pricing models create a perverse incentive: The more telemetry you ingest, the more you pay. Teams respond rationally by limiting what they collect. They drop verbose cloud audit logs, sample instead of capturing everything, or skip entire telemetry sources. Each of those decisions is a detection gap disguised as a budget decision. The irony is that the data you can't afford to ingest is often the data that would catch the threats your current coverage misses.
The alternative isn't much better. Teams that route telemetry to a data lake to avoid SIEM ingestion costs lose the detection capabilities they depend on. In fact, data lakes lack the native classifiers needed to discover unknown threats, detections run as scheduled searches that don't scale, and investigation interfaces miss the pivoting and visualization features analysts rely on. So security teams end up stuck between two broken approaches: send everything to the SIEM and face spiraling costs, or keep telemetry in a data lake and lose detection depth. Either way, threats buried in high-volume logs go undetected.
Enterprise SIEMs
Enterprise Data Lakes
The cost stack is rarely just the license. Per-GB ingestion charges are the visible part, while add-on modules for behavioral analytics or UEBA carry separate fees. Third-party threat intelligence API keys cost extra. Professional services get scoped in to build the data pipelines and tune the rules. By the time the platform is running, the total cost bears little resemblance to the original quote.
The operational side also compounds the problem. Many detection tools require you to build and maintain data pipelines, manage detection content libraries, curate threat intelligence feeds, and write suppression rules to reduce noise. This type of infrastructure work pulls engineering time away from actual threat hunting and investigation.
A threat detection tool should solve these problems together:
- On cost: Usage-based pricing tied to event volume or endpoint count, not raw data ingestion. When you're not penalized for collecting more telemetry, the incentive to create visibility gaps disappears.
- On overhead: Out-of-the-box detections with automatic baseline tuning, managed threat intelligence, and built-in suppression controls for known-good infrastructure. You shouldn't need a three-month onboarding project before the tool catches anything useful.
- On deployment: SaaS for simplicity or on-premise for regulated environments, with feature parity between the two.
AlphaSOC operates as a managed service built around reducing legacy data processing costs. Teams send raw telemetry in its native format, then AlphaSOC handles the parsing, normalization to OCSF, and threat intelligence enrichment. Prebuilt parsers for sources like AWS, Azure, CrowdStrike, and Slack mean that there's no onboarding project to build custom pipelines. The output is refined OCSF findings, ready for your SIEM at a fraction of what it would cost to run that processing inside the SIEM itself.
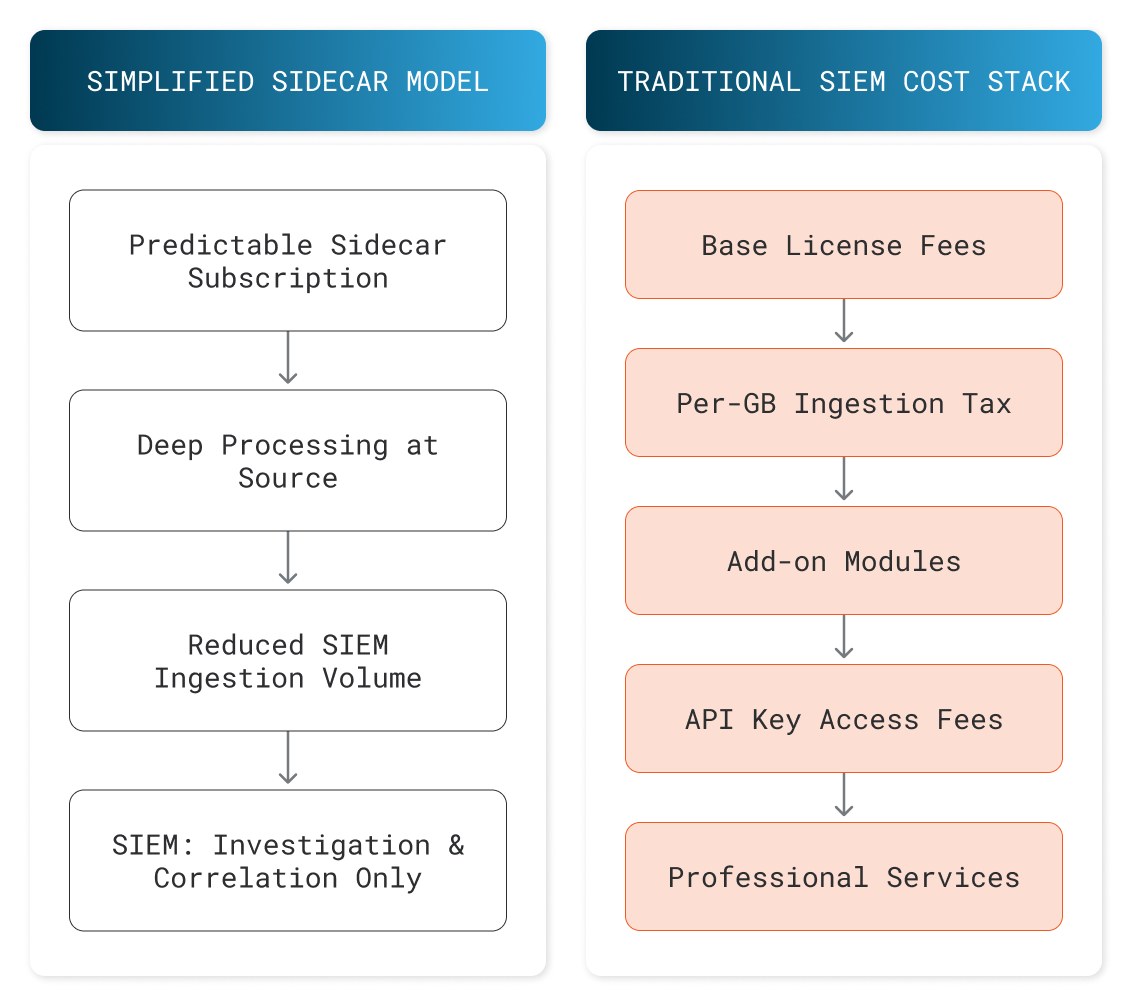
On the right, a typical SIEM cost stack. On the left, a simplified model where the sidecar engine handles deep processing at predictable cost while the SIEM focuses on investigation and correlation.
Conclusion
The features in this article point toward a single architectural pattern: a purpose-built detection engine that sits alongside your SIEM, processes telemetry more deeply than the SIEM can on its own, and delivers enriched alerts into your existing workflows. The SIEM stays. It does what it was designed to do. The sidecar fills the gap that the SIEM was never meant to cover.
Two open standards belong on your evaluation checklist. Sigma for detection as code provides portable, version-controlled rules that aren't tied to a single platform. OCSF for data normalization gives you a queryable telemetry lake that works across sources. Native support for both, not just compatibility but first-class support, eliminates the translation layers and conversion overhead that slow teams down.
When you're evaluating tools, push on the specifics. Ask if;
- Threat intelligence is included, or if you have to bring your own.
- The system can perform prevalence scoring to highlight outliers.
- Additional integrations are needed (e.g., API keys for DomainTools, Recorded Future, VirusTotal).
- The API covers everything the console does, because that determines whether your SOC can automate around it.
The answers will separate the tools that genuinely augment your detection capability from the ones that just add another dashboard to check.