
A Guide to Cybersecurity Monitoring Tools
Learn how security teams use cybersecurity monitoring tools to collect logs, enrich events, and generate high-confidence findings.
Cybersecurity monitoring tools collect, enrich, and analyze logs from cloud platforms, applications, networks, and endpoints to generate accurate, high-fidelity findings for investigation. It is important that you optimize your monitoring pipeline to prevent alert fatigue and reduce friction within your SOC (e.g., reduce the manual effort required to enrich events during investigations).
Splunk's State of Security 2025 Report revealed that 59% of respondents reported too many alerts and 55% too many false positives. 57% said data management gaps cost them valuable investigation time.
A security data pipeline that automatically enriches telemetry produces accurate findings you can trust, rather than a flood of low-fidelity signals that are missing context. Your team gets back the hours that triage was eating.
No single tool offers a unified security operations platform with enterprise routing, enrichment, detection, hunting, and response features. Instead, most teams combine "best-of-breed" products to close known gaps across these layers. The table below describes common feature categories and respective vendors.
| Category | Role in your stack | Example vendors |
|---|---|---|
| Security Data Pipeline Platform (SDPP) | Collect, route, and enrich data | Abstract Security, Axoflow, Cribl, Databahn, Monad |
| Detection Engine | Further enrich telemetry and execute complex detection logic outside of the SIEM | AlphaSOC |
| Security Data Lake | Long-term storage of normalized, indexed security data | AlphaSOC, Amazon, Scanner, and companies building on ClickHouse, Databricks, and Snowflake |
| Security Information and Event Management (SIEM) | Centralized search, correlation, and investigation | Abstract Security, CrowdStrike, Datadog, Elastic, Google, Microsoft, Rapid7, Splunk, Sumo Logic |
| Security Orchestration, Automation, and Response (SOAR) | Management of triage, investigation, and response workflows | Palo Alto Networks, Rapid7, Splunk, Swimlane, Tines, Torq |
| Extended Detection and Response (XDR) | Endpoint detection and response extended to cloud, application, and network | Cisco, CrowdStrike, Elastic, Microsoft, Palo Alto Networks, SentinelOne |
| Query Engine | Federated search against different security data sources | Query.AI, Vega |
| AI Security Operations Center (AI SOC) | Next-generation SIEM platforms that bundle in-built AI agents | Anvilogic, Artemis Security, Panther, RunReveal |
| AI Threat Hunting | Agentic threat hunting platforms | Dropzone AI, Nebulock, Vega |
| AI Investigations | Agentic platforms for triage, investigation, and response | Dropzone AI, Command Zero, Intezer, Prophet Security |
This guide focuses on the Security Data Pipeline Platform (SDPP) and Detection Engine categories. SDPP tools collect, normalize, and route telemetry, but were not designed to run detection logic or perform deep inspection of events. Detection engineering teams turned to SIEM and Data Lake platforms to hunt for threats and run detection logic, but realized that these tools lack the necessary processing depth to solve the "patient zero" problem and identify novel, emerging threats.
Detection Engines provide a dedicated, optimized way to enrich data and apply detection logic to telemetry outside of the SIEM or Data Lake. This is the critical upstream processing capability that many stacks are missing.
When comparing tools, be sure to consider the capabilities below to judge each by the features and cost savings it provides, not by the dashboards it ships.
Summary of Key Cybersecurity Monitoring Tool Capabilities
| Feature | How it's done | What to look for |
|---|---|---|
| Collection and normalization | Collect telemetry from cloud platforms, SaaS applications, networks, and endpoints, then parse and normalize events to a common schema. | Broad source coverage (AWS, Azure, GCP, Okta, GitHub, Slack, DNS, network flow, EDR), normalization to an open schema (e.g., OCSF or ECS), and low pipeline maintenance. |
| Enrichment | Enrich raw events with threat intelligence, reputation, prevalence, and identity context before detection logic is run. | In-built threat intelligence, reputation scoring, and prevalence analysis. |
| Detection and hunting | On-stream and retrospective execution of in-built managed detection rules along with custom, user-generated rules. | Native Sigma support for custom detection rules. |
| Detection management | Adjust detection logic and add environment-specific detection language without maintaining multiple query language versions. | Native Sigma support, MITRE ATT&CK alignment, and APIs to support detection as code pipelines. |
| Scoring and escalation | Cluster individual alerts, score them, and prioritize related detections to escalate them as findings. | System logic and features to group individual alerts into findings or incidents. |
| SOC and AI workflow integration | Route findings to your existing SIEM, SOAR, and AI tools. | Published APIs and native integrations for Splunk, Google SecOps, Cribl, Anthropic, OpenAI, and other platforms. |
Collection and Normalization
Collection
Your cybersecurity monitoring coverage should reflect the systems attackers actually target. Infrastructure logs remain important, but you also need visibility into cloud workloads, SaaS applications, identity providers, endpoints, and network logs.
Start with the sources that reveal credential misuse, privilege escalation, data exfiltration, configuration drift, malware beaconing, and high-risk data access.
For most organizations, the first set of high-value sources includes identity sign-ins, MFA events, cloud audit logs, administrative events, DNS queries, network flow, and telemetry from EDR platforms. These sources let analysts answer practical questions:
- Which identity generated the suspicious behavior
- Where the suspicious behavior originated
- How that identity was authenticated by the system
- What actions were performed across cloud workloads and applications
- If the threat actor pivoted to move laterally within the environment
- Whether data was exfiltrated or malware was installed
Credential abuse is one key reason to monitor across sources. Verizon's 2025 Data Breach Investigations Report revealed that stolen credentials were the initial access vector in 22% of breaches and featured in 88% of web application attacks. To close this gap, your monitoring tool has to see identity, application, and resource activity.
Consider an incident involving events across Okta, AWS, and S3. An attacker signs in through Okta from an unusual location, changes an AWS IAM policy, and shortly afterward, modifies an S3 bucket policy to allow public access. No single log source tells the whole story:
| Source | What it shows |
|---|---|
| Okta sign-in | Authentication from an unusual location |
| AWS IAM | A privilege or policy change |
| AWS S3 access | The resulting exposure |
The attack only becomes visible as a sequence when your SOC collects and analyzes all three together.
Attacker activity can also occur where endpoint tools have limited reach. Mandiant's M-Trends 2026 Report revealed the global median dwell time was 14 days because adversaries maintain long-term access to devices that do not generate telemetry. Monitor only endpoints and servers, and you miss critical activity across your cloud workloads, applications, and networks.
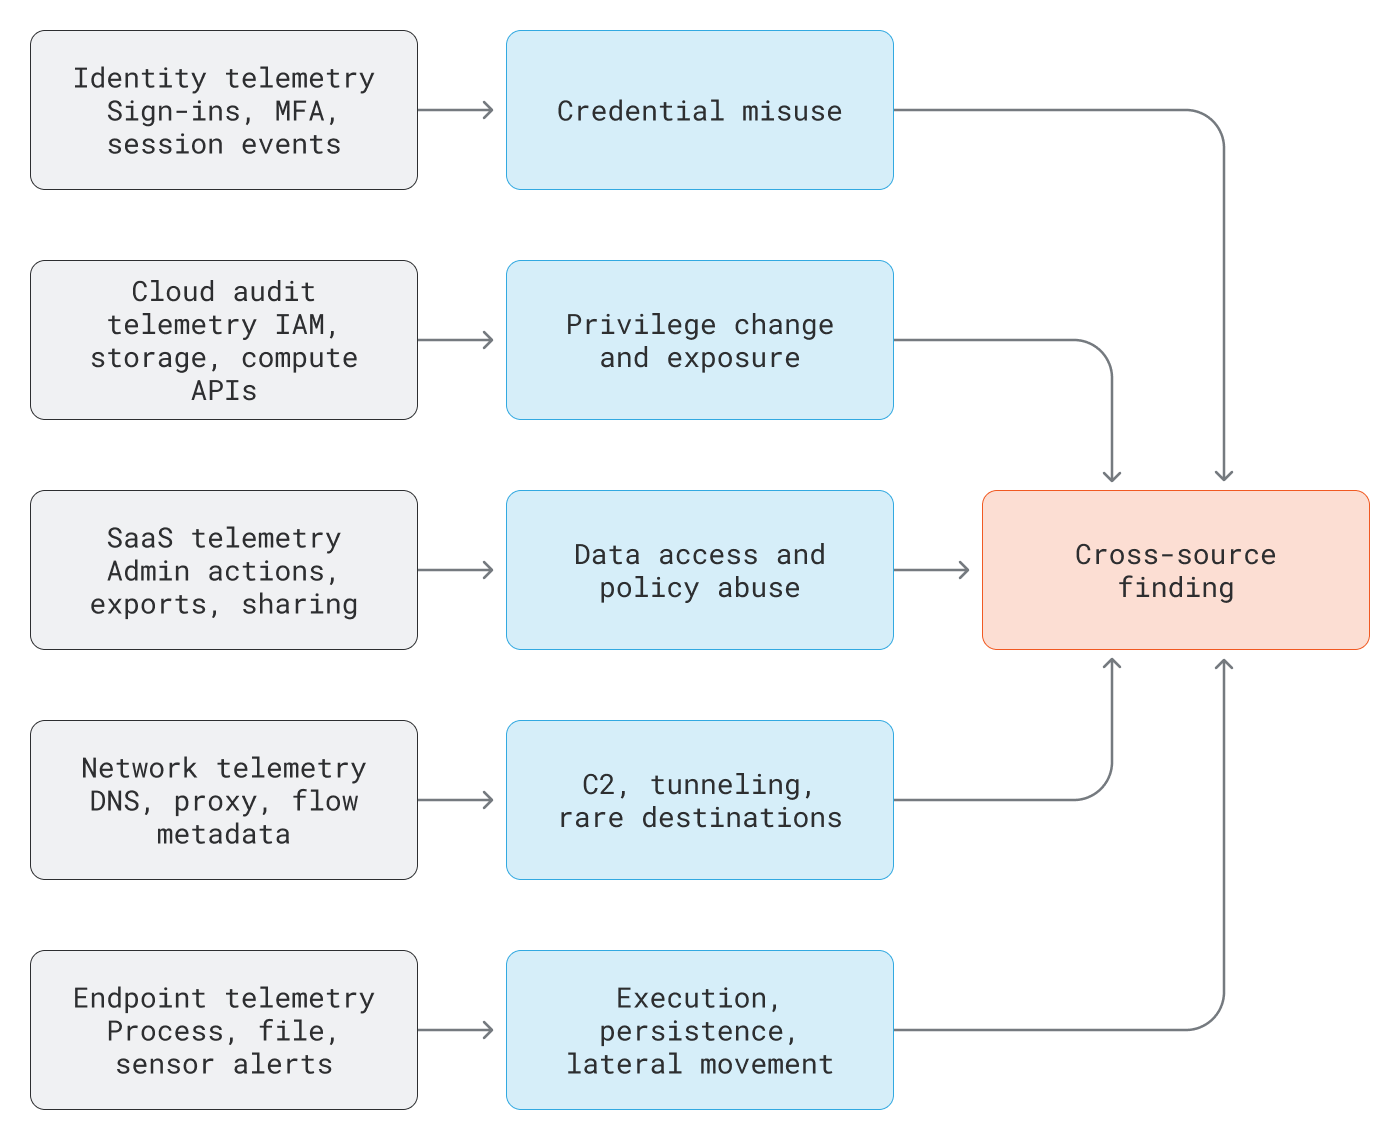
The diagram below shows why broad monitoring needs more than one telemetry class. Each source reveals a different part of the attack path.
Cost challenges
The practical obstacle to increasing visibility and coverage is cost. Many SIEM vendors charge by ingestion volume, a model sometimes called the "hidden tax on security," which makes high-volume telemetry expensive to index continuously. Splunk's licensing, for example, describes workload and ingest licensing models for different deployment patterns.
If a cost model discourages inspection of network logs, endpoint telemetry, or cloud audit events, budget control becomes a visibility trade-off. A dedicated, optimized engine that performs enrichment upstream can help you to preserve coverage without sending raw, unrefined, low-fidelity events to the SIEM.
How AlphaSOC helps
AlphaSOC processes logs from the systems your business relies on. We ingest telemetry from any source.















Deep inspection of raw, high-volume, low-value telemetry occurs before the SIEM to significantly reduce cost. The SIEM receives finished findings rather than raw logs, so you pay to store only what you actually investigate, not everything you collect.
Normalization
A login event from Okta, an application event from GitHub, and an API call to AWS may all describe a user action, but the data sources and audit log fields do not naturally align. Data normalization is critical to power effective detections, threat hunts, and investigations.
Your cybersecurity monitoring tool should normalize data into an open, common schema, containing information like:
- Consistent timestamps and normalized actors
- Stable source and destination fields
- Clear resource identifiers
- Enough original evidence to validate the event
A common schema enables security teams to run detections, threat hunts, and investigations using normalized field names, regardless of the log source. Popular open source schemas are listed below.
| Schema | Description |
|---|---|
| Open Cybersecurity Schema Framework (OCSF) | A Linux Foundation project to create a common language for security data. Contributors include Amazon, Cisco, CrowdStrike, IBM, Microsoft, Okta, and Splunk. |
| Elastic Common Schema (ECS) | An open source specification, developed with support from the Elastic user community. ECS defines a common set of fields to be used when storing event data in Elasticsearch, such as logs and metrics. |
| Open Source Security Events Metadata (OSSEM) | A community-led project that focuses primarily on the documentation and standardization of security event logs from diverse data sources. The Advanced Security Information Model (ASIM) used by Microsoft Sentinel is aligned with OSSEM. |
How AlphaSOC helps
Modern security data pipelines and detection tools align with open standards to ensure interoperability. AlphaSOC normalizes telemetry to OCSF, enables flexible detection with OCSF fields, and generates OCSF findings that can be instantly used by SIEM, SOAR, and AI SOC tools that support the standard.
Enrichment, Detection, and Hunting
It is important that enrichment occurs before alerts are generated, so detection and scoring logic can evaluate activity using threat intelligence, reputation, geolocation, prevalence, user behavior and other context.
A DNS alert indicates a host contacted a suspicious domain. The same event, enriched, can show that the domain is:
- Globally rare and only recently observed
- Resolving to suspicious infrastructure in an unusual ASN
- Contacted by only one endpoint in your environment
- Queried at regular intervals, indicating a malware beaconing pattern
Surface patient zero activity
Patient zero activity appears before a domain, IP address, API caller, or behavior has been widely classified as malicious. If your monitoring tool relies only on known-bad lists, you are at risk of becoming an early victim of a new attack. For how prevalence and behavioral scoring surface that first foothold, see Finding Patient Zero with Security Analytics.
Enrichment should include a prevalence measurement to describe how rare an event is. A destination, API caller, login source, or administrative action may be worth investigating if it is rare globally, rare within your environment, or unique to a single tenant. Rarity does not prove maliciousness, but encourages deeper investigation.

Built-in, not just add-ons
Check whether threat intelligence, prevalence scoring, and enrichment come with the tool or require add-ons. Many vendors charge extra, through subscriptions and third-party API keys, to provide the context that your team needs.
Each add-on raises both the annual cost and the maintenance overhead.
AlphaSOC maintains its own threat intelligence platform and enriches data upstream, before the SIEM, instead of leaving it as a post-alert chore within the SOAR workflow. The platform scores every event across six dimensions to attach key contextual signals to highlight threats.
A hit against an indicator on a threat feed will flag known malicious activity, but to discover unknown, emerging threats that aren't yet known to security vendors, you need to consider prevalence, reputation signals (e.g., age of the domain, or the ASN that the IP addresses under it are using), and use anomaly detection. The idea is to combine several weak signals to prioritize high-risk patterns to investigate. AlphaSOC measures prevalence both within and across customer environments to surface rare API calls, unexpected administrative actions, rare network destinations, and atypical configuration changes.
Managed and custom detections
Detections run against normalized and enriched telemetry. You need two kinds.
Managed detections
Most cybersecurity monitoring tool vendors ship in-built managed detections that provide baseline coverage mapped to a shared model or attack behavior, usually MITRE ATT&CK, whose April 2026 update lists 15 tactics, 222 techniques, and 475 sub-techniques within the Enterprise domain. You do not need a detection for every technique, but your tool should enable you to express coverage in terms that everyone, from detection engineers to leadership, already understands.
Custom detections
Custom detection covers what's specific to you, such as sensitive repositories, privileged roles, regulated data stores, and unusual admin workflows. Custom detections should be portable where possible, and ideally written in Sigma. The SigmaHQ GitHub repository is a source of community detection rules. Sigma enables your team to express detection logic in a readable format that is not tied to a single backend query language (e.g., SPL, KQL, or EQL).
The Sigma rule below follows a documented structure (including metadata, log source, detection, and condition) to detect when a user is locked out. Security teams write Sigma rules to express environment-specific monitoring logic in a portable format.
title: Okta User Account Locked Out
id: 14701da0-4b0f-4ee6-9c95-2ffb4e73bb9a
status: test
description: Detects when a user account is locked out.
references:
  - https://developer.okta.com/docs/reference/api/system-log/
  - https://developer.okta.com/docs/reference/api/event-types/
author: Austin Songer @austinsonger
date: 2021-09-12
modified: 2022-10-09
tags:
  - attack.impact
logsource:
  product: okta
  service: okta
detection:
  selection:
    displaymessage: Max sign-in attempts exceeded
  condition: selection
falsepositives:
  - Unknown
level: medium
Detection tuning
Good tuning cuts noise without hiding or obfuscating real risk. Poor tuning creates blind spots, such as a suppression for a known-good service that never expires, or a severity downgrade that buries a malicious pattern.
AlphaSOC ships managed detections aligned with MITRE ATT&CK and supports custom detections in native Sigma, without conversion to other query languages. The conversion point matters because detection rule translation creates significant maintenance overhead for your team. Your cybersecurity monitoring tool should enable you to manage detection logic using version control and a CI/CD pipeline. Adjustments to rules are properly tracked outside of your SIEM to increase SOC efficacy.
Escalation
Escalation is the handoff. Once the detection pipeline has scored and correlated the telemetry, it generates findings that carry their own context, and delivers them to the tools your team already works with. That last step is what saves each analyst time. If they have to open five browser tabs to check a domain's reputation, an asset's owner, a user's history, and related activity after the finding lands, the tool hasn't done its job. It just moved the tasks to another window.
A raw alert says something happened, but a detailed finding explains:
- What happened
- Why it matters
- Who or what was affected
- What evidence supports the conclusion
- How confidently the system is escalating it
For instance, an alert states, "Suspicious DNS query observed", while a detailed finding describes the endpoint, user, domain, query pattern, rarity, reputation, and source evidence. The analyst should not have to enrich the data manually.
This difference significantly impacts investigation speed. IBM's 2025 Cost of a Data Breach Report revealed the global average breach lifecycle (i.e. the time to identify and contain a breach) was 241 days. Organizations uncovering breaches internally saved about $900,000 versus those whose breach was disclosed by an external third party.
Correlate related detections into a single finding
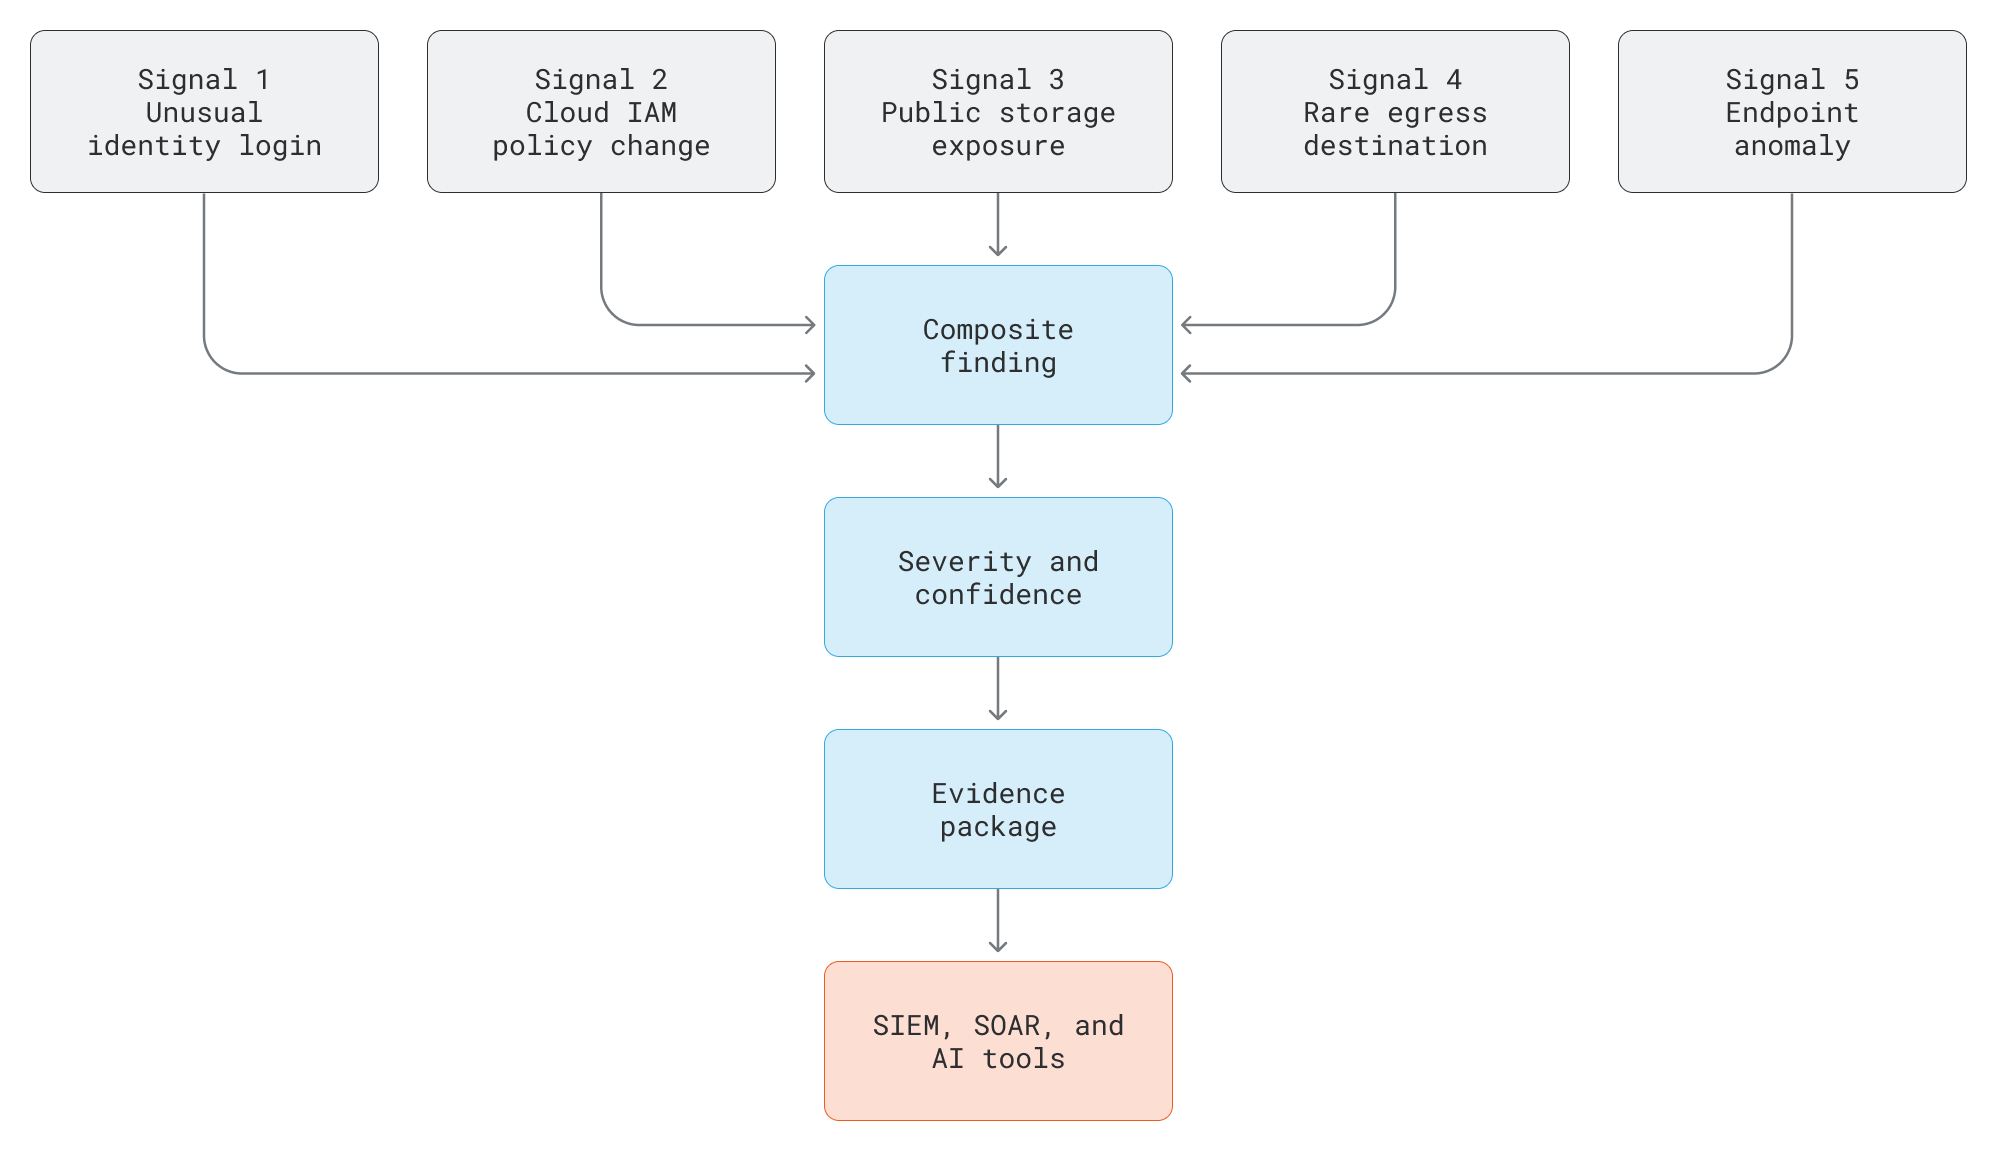
Your SIEM should correlate detections across identities, endpoints, resources, and applications. If your analyst receives five separate alerts (which often lack useful context), they must manually build the incident narrative. By combining signals, the analyst receives a high-confidence finding with the supporting evidence and context included.
Consider the earlier Okta → AWS IAM → S3 sequence: the login, the policy change, and the bucket exposure are each defensible alone, but correlated across identity and timeframe, they describe a single attack path.
The diagram below demonstrates how correlation changes the analyst's starting point. Modern security teams should seek to combine multiple signals into a single finding and pass this material to the systems where investigation occurs.
How AlphaSOC helps
AlphaSOC normalizes, enriches, and scores raw telemetry upstream of SIEM, SOAR, and AI tools to escalate findings with critical context included. Evidence travels with each finding instead of relying on an analyst to rebuild it all by hand. Findings are sent to your existing tools (e.g., Cribl, Splunk, Google SecOps, or Microsoft Sentinel) in OCSF format for investigation.
Standardizing on OCSF is what makes that portable. Because every finding uses the same open schema: a SOC analyst, a SOAR playbook, a ticket owner, and an agentic workflow all read the same structured record, no translation required.
Each finding carries its severity, confidence, affected entities, and evidence, along with a correlation ID that links it back to the full source event and to any related detections. Your SIEM uses that shared ID to group related findings into a single incident, working from one open vocabulary rather than a vendor-specific record.
The JSON example below shows the core of an AlphaSOC finding. The top fields identify it as an OCSF Detection Finding, and the metadata block carries the correlation_uid for further investigation.
{
  "category_name": "Findings",
  "category_uid": 2,
  "class_name": "Detection Finding",
  "class_uid": 2004,
  "metadata": {
    "correlation_uid": "abe76dab-cd9c-4cb5-b6e2-9e15f7b46406",
    "event_code": "finding",
    "product": { "vendor_name": "AlphaSOC" },
    "version": "1.5.0"
  }
}
This is trimmed to the fields that matter for correlation. Please see the AlphaSOC documentation to investigate the complete structure and understand how the engine separates source context from individual detections.
Hunt and Investigate
Detection rules flag threats as they occur in real time. Suspicious activity that slipped past this analysis can lead to an incident. Without stored telemetry, the opportunity to hunt threats and investigate odd behavior is gone.
A security data lake keeps it open because it retains normalized and indexed telemetry long enough to search backward, and the two jobs run against that history.
- The first is retrospective hunting, meaning you take today's rules and intelligence and run them over months of historic data, surfacing activity that was not flagged at the time. A domain that meant nothing a few months ago becomes a lead once it shows up in a threat feed.
- The second is investigation. When a finding arrives, an analyst rarely wants the triggering event only. Instead, they want all of the events for a specific identity or asset for a certain timeframe.
For this to work, your system needs to make data retention easy, inexpensive, and efficient.
AlphaSOC indexes and stores normalized telemetry in a managed data lake your team can use. A threat hunter can run queries across months of data, and an analyst can pull the raw data around a finding without leaving their workflow. Because the events are normalized, indexed, and available via API, your AI tools can access them in the same way.
AI SOC Workflow Integration
Cybersecurity monitoring tools should complement your existing SOC stack to improve the quality of your security data. This matters most as AI becomes an integral part of modern security operations. Your tools should generate useful, high-fidelity data in a way that AI agents can use.
Tools that expose read-only APIs can hinder agentic workflows. You also want agents, AI SOC, and AI SOAR platforms to be able to interact with the tool to:
- Retrieve detection findings, alerts, and evidence
- Retrieve detection logic and metadata (e.g., MITRE ATT&CK details)
- Write new detection rules and update/adjust existing logic
- Query the data lake to retrieve telemetry during investigations
- Retrospectively run detections and initiate threat hunts
- Hand a case to a human with the evidence intact
Ask which endpoints exist before assuming an agent can operate the platform.
How AlphaSOC helps
AlphaSOC natively integrates with your existing security stack, as shown below. The engine pushes findings to your SIEM, SOAR, and AI tools so that both analysts and agents work from the same detection output.





Conclusion
Before you select a cybersecurity monitoring tool, review your current security stack to identify feature gaps between layers (e.g., missing enrichment steps in your security data pipeline that reduce alert fidelity in the SIEM), understand the steps that analysts are undertaking manually (e.g., looking up indicators during investigations), and identify other overheads (e.g., pipeline maintenance costs and translating detection rules to proprietary formats).
Those gaps will tell you whether you need another dashboard or an optimized pipeline to power your existing SIEM, SOAR, and AI tools. A modern security data pipeline should be able to:
- Collect and normalize events from many sources
- Perform deep enrichment before detection
- Support both managed and custom detection rules
- Correlate related activity to generate meaningful alerts
- Group and escalate prioritized findings to your existing tools
AlphaSOC runs this pipeline end to end. We collect events from your cloud platforms, applications, networks, and endpoints, normalize them, and enrich them with threat intelligence and prevalence data. Our engine then runs both managed and custom detections, correlates the results, and hands your analysts complete findings instead of raw alerts that are missing context.